by
July 12th, 2011
July 12th, 2011
Wells Fargo Senior Analyst Anthony Gallo published an excellent document on March 28 highlighting critical problems with CSA 2010. You can contact me or contact Anthony directly at anthony.gallo@wellsfargo.com for the full document, but I want to highlight a couple of key points.
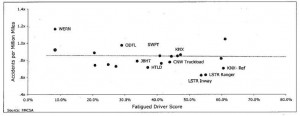
The analysis shows little or no correlation between the CSA BASIC scores for unsafe driving and fatigued driving and accidents per million miles. Everyone wants to see continued reductions in truck-related accidents. It appears, however, that the key CSA measures that would indicate a carrier should be a candidate for further scrutiny bear no relationship to the actual safety ratings of those carriers. This is one of numerous reasons why shippers should not use CSA data to create their own carrier credentialing methodologies. Here is an excerpt from the Wells Fargo publication.
FMCSA assigns a composite score in seven Behavior Analysis and Safety Improvement Categories (BASICs) along with a corresponding “limit” threshold. When a carrier breaches the threshold, corrective actions must be taken to remedy the violations. Serious or persistent violations can result in enforcement actions against either the driver or carrier. Motor carriers initially receive a “warning letter” informing them of their violations. According to several reports as many as 50,000 letters were expected to be sent in H1 2011.
When we dissected the underlying data in relation to the composite scores, we were somewhat surprised to see that there was little correlation between the scores and the actual number of accidents and injuries/fatalities. Specifically, we observed little correlation between poor scores in the Unsafe Drivers and Fatigued Drivers categories and the actual number of accidents or injuries/fatalities. Further, we could not find and are not aware of FMCSA data that statistically demonstrates a correlation behind these factors and accidents. Certainly, it is intuitive that “unsafe drivers” and “fatigued drivers” should be more prone to accidents. However, this does not appear to be the case. We feel this may be due, in part, to the methodology by which the categories are scored. For example, unfavorable Fatigued Drivers scores typically result from Hours of Service violations, but also include Logbook violations and errors. So while a fatigued/tired driver (assumed to be tired if outside of HOS criteria) may indeed be more likely to be involved in an accident, one with Logbook errors would perhaps not be. Thus, if an unfavorable Fatigued Driver score is in fact being driven by Logbook errors, the composite score would be less likely to correlate with accidents, in our view.
We understand the Unsafe Drivers/Driving category is meant to capture speeding, reckless driving, improper lane changes, etc. Certainly we think these behaviors should be captured and likely have some correlation with accidents. However, there are literally dozens of subcategories within the Unsafe Driving category, and a severity weight is given to each violation subcategory. This may help explain some of the disconnect between the scores and the actual number of accidents. For example, “reckless driving” and “texting while driving” both carry 10 point weights. Conversely, “failure to use a seatbelt” has a 7 weight whereas “improper lane change” and “following too close” each carry a 5 weight, although intuitively the latter two appear to be less safe activities, in our view.
Tom Sanderson is chairman, president & CEO of Transplace, a leading provider of logistics technology and transportation management services. Sanderson’s nearly 30 years of experience includes senior executive roles at Clicklogistics and PTCG, Inc. He also spent several years in the trucking industry, holding management positions at J.B. Hunt Special Commodities, Inc., J. B. Hunt Transport, J. B. Hunt Logistics (now Transplace) and Schneider National. Sanderson also has consulting experience with Mercer Management Consulting and Andersen Consulting (now Accenture). Sanderson has a master’s in business from Indiana University, has been married for 28 years and has three children.


Very Good information, although another component that the FMCSA either can not or chooses not to measure is the actual fault of the accident. According to Lawcore.com "Twelve percent of all traffic fatalities in the United States are caused because of truck accidents. Tractor trailer truck accidents are especially dangerous. In such truck accidents, an alarming 98% of the time, the passengers or driver in the other vehicle is killed as opposed to people in the truck.
ReplyDeleteBut this does not indicate that the truck driver is mainly at fault in truck accidents. Contrary to popular belief, more than 75% of truck accidents are caused, not by the truck driver, but because of an error of the driver of other smaller vehicles involved in the crash."
Another component that FMCSA chooses not to measure from a safety point of view the number of hours a truck sits at a pickup or drop point. The industry standard of two hours at either location very often turns out to be 4-6 hours without any detention pay. Those hours take away from driving hours meaning less money to pay bills at the end of the week or month. The owner operator or small company driver who is usually operating on earnings per mile or percentage of load is going to cheat some way to off set the potential loss of income. Thus potentially becoming a safety hazard. Some sort of regulation needs to be implemented on time limits for loading or unloading and the amount to be paid for time exceeding those limits. This could well reduce the number of accidents that are created by tired drivers. Lets face this issue.
ReplyDeleteThe FMCSA and DOT have no jurisdiction over shippers and consignees. They don't have the power to dictate loading and unloading times.
Delete